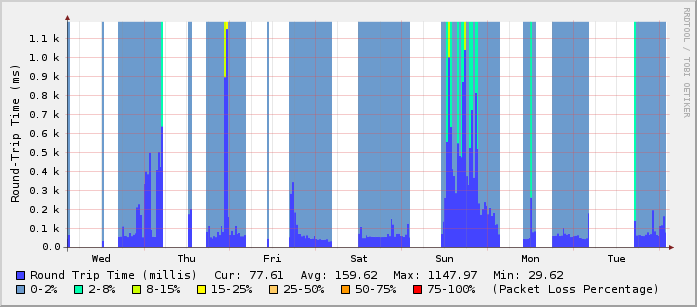
To get some nice graphs showing your round trip time and your packet loss, like the following image, follow the steps below:
What you need before you start: rrdtool and a cron server (vixie-cron is fine).
a) Execute the following
 /usr/bin/rrdtool create /var/rrds/ping/ping_wan.rrd \

--step 300 \

DS:pl:GAUGE:600:0:100 \

DS:rtt:GAUGE:600:0:10000000 \

RRA:AVERAGE:0.5:1:800 \

RRA:AVERAGE:0.5:6:800 \

RRA:AVERAGE:0.5:24:800 \

RRA:AVERAGE:0.5:288:800 \

RRA:MAX:0.5:1:800 \

RRA:MAX:0.5:6:800 \

RRA:MAX:0.5:24:800 \

RRA:MAX:0.5:288:800
You can change /var/rrds/ping/ping_wan.rrd to the path/file.rrd you wish.
b) Save the following to the file ping.sh
ping.sh.gz
Change the ping_host www.ntua.gr to the one of your choice. Make the script executable, chmod +x ping.sh.
#!/bin/bash

PING=/bin/ping

COUNT=4

DEADLINE=10

ping_host() {

local output=$($PING -q -n -c $COUNT -w $DEADLINE $1 2>&1)

# notice $output is quoted to preserve newlines

local temp=$(echo "$output"| awk '

BEGIN {pl=100; rtt=0.1}

/packets transmitted/ {

match($0, /([0-9]+)% packet loss/, matchstr)

pl=matchstr[1]

}

/^rtt/ {

# looking for something like 0.562/0.566/0.571/0.024

match($4, /(.*)\/(.*)\/(.*)\/(.*)/, a)

rtt=a[2]

}

/unknown host/ {

# no output at all means network is probably down

pl=100

rtt=0.1

}

END {print pl ":" rtt}

')

RETURN_VALUE=$temp

}

# ping a host on the local lan

ping_host www.ntua.gr

/usr/bin/rrdtool update \

/var/rrds/ping/ping_wan.rrd \

--template \

pl:rtt \

N:$RETURN_VALUE
ping.sh.gz
Change the ping_host www.ntua.gr to the one of your choice. Make the script executable, chmod +x ping.sh.
If you have changed the /var/rrds/ping/ping_wan.rrd on step (a) you have to change it here too.
c) Save the following to ping-graph.sh and make it executable.
If you have changed /var/rrds/ping on step (a) you need to change it here in the beggining of the script too.
 #!/bin/sh

cd /var/rrds/ping/

echo "

<HTML>

<HEAD><TITLE>Round-Trip and Packet Loss Stats</TITLE></HEAD>

<BODY>

<H3>Hourly Round-Trip & Packetloss Stats(1min average)</H3>

" > index.html

rrdtool graph ping_wan_hour.png -h 225 -w 600 -a PNG \

--imginfo '<IMG SRC=/stats/%s WIDTH=%lu HEIGHT=%lu >' \

--start -3600 --end -60 --x-grid MINUTE:10:HOUR:1:MINUTE:30:0:%R \

-v "Round-Trip Time (ms)" \

--rigid \

--lower-limit 0 \

DEF:roundtrip=ping_wan.rrd:rtt:AVERAGE \

DEF:packetloss=ping_wan.rrd:pl:AVERAGE \

CDEF:PLNone=packetloss,0,2,LIMIT,UN,UNKN,INF,IF \

CDEF:PL2=packetloss,2,8,LIMIT,UN,UNKN,INF,IF \

CDEF:PL15=packetloss,8,15,LIMIT,UN,UNKN,INF,IF \

CDEF:PL25=packetloss,15,25,LIMIT,UN,UNKN,INF,IF \

CDEF:PL50=packetloss,25,50,LIMIT,UN,UNKN,INF,IF \

CDEF:PL75=packetloss,50,75,LIMIT,UN,UNKN,INF,IF \

CDEF:PL100=packetloss,75,100,LIMIT,UN,UNKN,INF,IF \

AREA:roundtrip#4444ff:"Round Trip Time (millis)" \

GPRINT:roundtrip:LAST:"Cur\: %5.2lf" \

GPRINT:roundtrip:AVERAGE:"Avg\: %5.2lf" \

GPRINT:roundtrip:MAX:"Max\: %5.2lf" \

GPRINT:roundtrip:MIN:"Min\: %5.2lf\n" \

AREA:PLNone#6c9bcd:"0-2%":STACK \

AREA:PL2#00ffae:"2-8%":STACK \

AREA:PL15#ccff00:"8-15%":STACK \

AREA:PL25#ffff00:"15-25%":STACK \

AREA:PL50#ffcc66:"25-50%":STACK \

AREA:PL75#ff9900:"50-75%":STACK \

AREA:PL100#ff0000:"75-100%":STACK \

COMMENT:"(Packet Loss Percentage)"

echo "

<img src="ping_wan_hour.png"><br>

<br>

<H3>Daily Round-Trip & Packetloss Stats(1min average)</H3>

" >> index.html

rrdtool graph ping_wan_day.png -h 225 -w 600 -a PNG \

--imginfo '<IMG SRC=/stats/%s WIDTH=%lu HEIGHT=%lu >' \

--lazy --start -86400 --end -60 --x-grid MINUTE:30:HOUR:1:HOUR:2:0:%H \

-v "Round-Trip Time (ms)" \

--rigid \

--lower-limit 0 \

DEF:roundtrip=ping_wan.rrd:rtt:AVERAGE \

DEF:packetloss=ping_wan.rrd:pl:AVERAGE \

CDEF:PLNone=packetloss,0,2,LIMIT,UN,UNKN,INF,IF \

CDEF:PL2=packetloss,2,8,LIMIT,UN,UNKN,INF,IF \

CDEF:PL15=packetloss,8,15,LIMIT,UN,UNKN,INF,IF \

CDEF:PL25=packetloss,15,25,LIMIT,UN,UNKN,INF,IF \

CDEF:PL50=packetloss,25,50,LIMIT,UN,UNKN,INF,IF \

CDEF:PL75=packetloss,50,75,LIMIT,UN,UNKN,INF,IF \

CDEF:PL100=packetloss,75,100,LIMIT,UN,UNKN,INF,IF \

AREA:roundtrip#4444ff:"Round Trip Time (millis)" \

GPRINT:roundtrip:LAST:"Cur\: %5.2lf" \

GPRINT:roundtrip:AVERAGE:"Avg\: %5.2lf" \

GPRINT:roundtrip:MAX:"Max\: %5.2lf" \

GPRINT:roundtrip:MIN:"Min\: %5.2lf\n" \

AREA:PLNone#6c9bcd:"0-2%":STACK \

AREA:PL2#00ffae:"2-8%":STACK \

AREA:PL15#ccff00:"8-15%":STACK \

AREA:PL25#ffff00:"15-25%":STACK \

AREA:PL50#ffcc66:"25-50%":STACK \

AREA:PL75#ff9900:"50-75%":STACK \

AREA:PL100#ff0000:"75-100%":STACK \

COMMENT:"(Packet Loss Percentage)"

echo "

<img src="ping_wan_day.png"><br>

<br>

<H3>Weekly Round-Trip & Packetloss Stats(1min average)</H3>

" >> index.html

rrdtool graph ping_wan_week.png -h 225 -w 600 -a PNG \

--imginfo '<IMG SRC=/stats/%s WIDTH=%lu HEIGHT=%lu >' \

--lazy --start -604800 --end -1800 \

-v "Round-Trip Time (ms)" \

--rigid \

--lower-limit 0 \

DEF:roundtrip=ping_wan.rrd:rtt:AVERAGE \

DEF:packetloss=ping_wan.rrd:pl:AVERAGE \

CDEF:PLNone=packetloss,0,2,LIMIT,UN,UNKN,INF,IF \

CDEF:PL2=packetloss,2,8,LIMIT,UN,UNKN,INF,IF \

CDEF:PL15=packetloss,8,15,LIMIT,UN,UNKN,INF,IF \

CDEF:PL25=packetloss,15,25,LIMIT,UN,UNKN,INF,IF \

CDEF:PL50=packetloss,25,50,LIMIT,UN,UNKN,INF,IF \

CDEF:PL75=packetloss,50,75,LIMIT,UN,UNKN,INF,IF \

CDEF:PL100=packetloss,75,100,LIMIT,UN,UNKN,INF,IF \

AREA:roundtrip#4444ff:"Round Trip Time (millis)" \

GPRINT:roundtrip:LAST:"Cur\: %5.2lf" \

GPRINT:roundtrip:AVERAGE:"Avg\: %5.2lf" \

GPRINT:roundtrip:MAX:"Max\: %5.2lf" \

GPRINT:roundtrip:MIN:"Min\: %5.2lf\n" \

AREA:PLNone#6c9bcd:"0-2%":STACK \

AREA:PL2#00ffae:"2-8%":STACK \

AREA:PL15#ccff00:"8-15%":STACK \

AREA:PL25#ffff00:"15-25%":STACK \

AREA:PL50#ffcc66:"25-50%":STACK \

AREA:PL75#ff9900:"50-75%":STACK \

AREA:PL100#ff0000:"75-100%":STACK \

COMMENT:"(Packet Loss Percentage)"

echo "

<img src="ping_wan_week.png"><br>

<br>

<H3>Monthly Round-Trip & Packetloss Stats(1min average)</H3>

" >> index.html

rrdtool graph ping_wan_month.png -h 225 -w 600 -a PNG \

--imginfo '<IMG SRC=/stats/%s WIDTH=%lu HEIGHT=%lu >' \

--lazy --start -2592000 --end -7200 \

-v "Round-Trip Time (ms)" \

--rigid \

--lower-limit 0 \

DEF:roundtrip=ping_wan.rrd:rtt:AVERAGE \

DEF:packetloss=ping_wan.rrd:pl:AVERAGE \

CDEF:PLNone=packetloss,0,2,LIMIT,UN,UNKN,INF,IF \

CDEF:PL2=packetloss,2,8,LIMIT,UN,UNKN,INF,IF \

CDEF:PL15=packetloss,8,15,LIMIT,UN,UNKN,INF,IF \

CDEF:PL25=packetloss,15,25,LIMIT,UN,UNKN,INF,IF \

CDEF:PL50=packetloss,25,50,LIMIT,UN,UNKN,INF,IF \

CDEF:PL75=packetloss,50,75,LIMIT,UN,UNKN,INF,IF \

CDEF:PL100=packetloss,75,100,LIMIT,UN,UNKN,INF,IF \

AREA:roundtrip#4444ff:"Round Trip Time (millis)" \

GPRINT:roundtrip:LAST:"Cur\: %5.2lf" \

GPRINT:roundtrip:AVERAGE:"Avg\: %5.2lf" \

GPRINT:roundtrip:MAX:"Max\: %5.2lf" \

GPRINT:roundtrip:MIN:"Min\: %5.2lf\n" \

AREA:PLNone#6c9bcd:"0-2%":STACK \

AREA:PL2#00ffae:"2-8%":STACK \

AREA:PL15#ccff00:"8-15%":STACK \

AREA:PL25#ffff00:"15-25%":STACK \

AREA:PL50#ffcc66:"25-50%":STACK \

AREA:PL75#ff9900:"50-75%":STACK \

AREA:PL100#ff0000:"75-100%":STACK \

COMMENT:"(Packet Loss Percentage)"

echo "

<img src="ping_wan_month.png"><br>

<br>

<H3>Yearly Round-Trip & Packetloss Stats(1min average)</H3>

" >> index.html

rrdtool graph ping_wan_year.png \

--imginfo '<IMG SRC=/stats/%s WIDTH=%lu HEIGHT=%lu >' \

--lazy --start -31536000 --end -86400 -h 225 -w 600 -a PNG \

-v "Round-Trip Time (ms)" \

--rigid \

--lower-limit 0 \

DEF:roundtrip=ping_wan.rrd:rtt:AVERAGE \

DEF:packetloss=ping_wan.rrd:pl:AVERAGE \

CDEF:PLNone=packetloss,0,2,LIMIT,UN,UNKN,INF,IF \

CDEF:PL2=packetloss,2,8,LIMIT,UN,UNKN,INF,IF \

CDEF:PL15=packetloss,8,15,LIMIT,UN,UNKN,INF,IF \

CDEF:PL25=packetloss,15,25,LIMIT,UN,UNKN,INF,IF \

CDEF:PL50=packetloss,25,50,LIMIT,UN,UNKN,INF,IF \

CDEF:PL75=packetloss,50,75,LIMIT,UN,UNKN,INF,IF \

CDEF:PL100=packetloss,75,100,LIMIT,UN,UNKN,INF,IF \

AREA:roundtrip#4444ff:"Round Trip Time (millis)" \

GPRINT:roundtrip:LAST:"Cur\: %5.2lf" \

GPRINT:roundtrip:AVERAGE:"Avg\: %5.2lf" \

GPRINT:roundtrip:MAX:"Max\: %5.2lf" \

GPRINT:roundtrip:MIN:"Min\: %5.2lf\n" \

AREA:PLNone#6c9bcd:"0-2%":STACK \

AREA:PL2#00ffae:"2-8%":STACK \

AREA:PL15#ccff00:"8-15%":STACK \

AREA:PL25#ffff00:"15-25%":STACK \

AREA:PL50#ffcc66:"25-50%":STACK \

AREA:PL75#ff9900:"50-75%":STACK \

AREA:PL100#ff0000:"75-100%":STACK \

COMMENT:"(Packet Loss Percentage)"

echo "

<img src="ping_wan_year.png"><br>

<br>

</BODY>

</HTML>

" >> index.html
If you have changed /var/rrds/ping on step (a) you need to change it here in the beggining of the script too.
The above script creates a very simple index.html file inside /var/rrds/ping (unless you’ve changed it) with 5 graphs: hourly, daily, weekly, monthly and yearly
d) Add the following entries to your crontab:
*/5 * * * * /etc/mrtg/ping.sh

1,6,11,16,21,26,31,36,41,46,51,56 * * * * /path/to/ping-graph.sh
For better accuracy, you can change “–step 300″ to “–step 60″ in the rrd database creation script and then change the crontab entry for ping.sh from:
to
*/5 * * * * /etc/mrtg/ping.shto
* * * * * /etc/mrtg/ping.shOriginal ping script and rrd config for the graphs from http://haroon.sis.utoronto.ca/rrd/scripts/
Enjoy your graphs.
No comments:
Post a Comment